 by
by By Kristin Peixotto (@kpeixotto27), Rhea Gates (@rheakaigates) and Dominic Black (@dominic_black7)
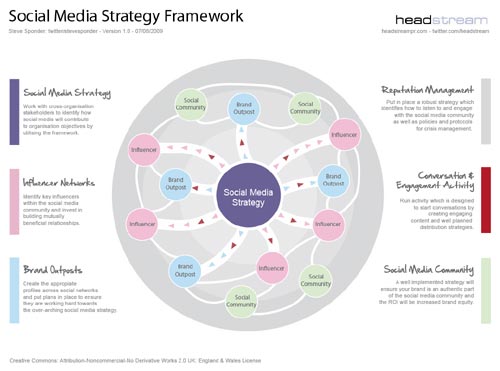
During class on Monday, February 13th we dove deep into social media audits and how to understand the data. Unfortunately, the class really just needed a mental health day so engagement was low.
But spirits we lifted a bit when the class got to hack into the Facebook page for the UO SOJC. Who knew that the majority of their Facebook followers are women 31-44. But apparently this has recently shifted to this:
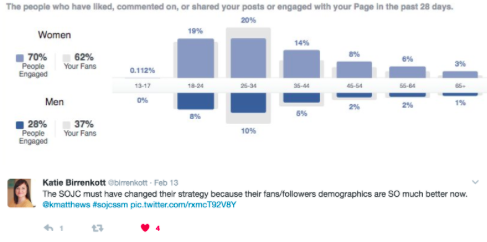
By hacking into this account we learned how different numbers measure the reach and engagement rates of followers. Reach refers to how many feeds a message has been delivered to, and engagement is the number of people who have actually interacted with the message. It’s important to understand the difference between the results of reach and engagement when analyzing the results of your campaign.
By looking at our social media data we can answer questions about our followers, content, topics, and distribution. The data can also show us if we are actually reaching the audience we are trying to engage. In the UO SOJC scenario, the target audience was students. When looking at the data, it was clear that the target audience was not being reached enough. The ability to look at the data at multiple points in time allows to change your strategy to address your followers.
We also learned about the dark side to social. Apparently, dark social is when “dark social analysts are trying to slide to the DMs.” This accounts for 60% of all content. It’s “dark” because about no one can track the data.
To end this exciting Monday class Kelli recommended that the class do yoga and take a nap. When all else fails take a nap and be ready to learn more about analytics on Wednesday.
Tweet Results:
Despite SOJCssm’s lackluster energy on Twitter and in the physical world of the classroom, with a total of 121 tweets, our total reach was 168,163, a happy surprise.
The tweets consisted of 81 original tweets, 24 @messages and 16 retweets.
Overall there were 26 contributors to the twitter conversation which resulted in 202,369 timeline deliveries. Surprisingly, this twitter session did not include as many memes and gifs as previous twitter conversations had. Only 11 memes or gifs were tweeted out of the 20 total images attached to tweets. There were 86 tweets without any media and only 35 with media attached. Similarly, 87 tweets did not include a link and 36 tweets.
Contributor standouts:
Most active: @kpeixotto27
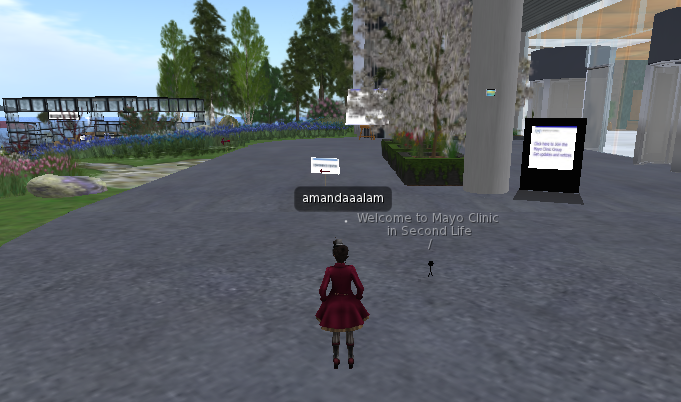
Most reach (not including @kmatthews or organizations): @amandaalam
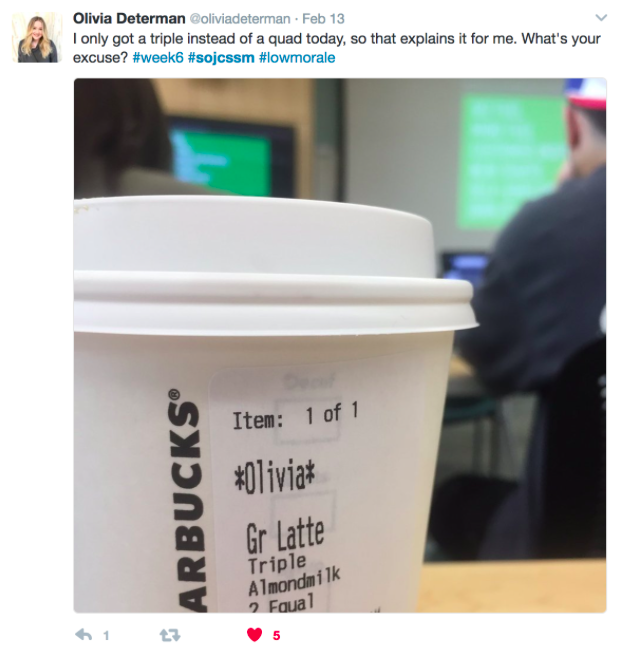
Most retweets: @oliviadeterman
How do you interpret that data!
Hi- this is a great post to address the importance of social media evaluation. Although it was a slow day in class that Monday, the material being focused on was very relevant and important. From a proper social media audit, one can gather a very wide variety of information about it’s public, or target audience(s).
I loved the photo you chose to include with your tweet and Starbucks order. It may seem like a small detail, but it automatically made the post relatable and incorporated humor.
The SOJCssm Twitter analysis was a great example of the type of work we were studying in class.